Meet Balance
Clear money. Clear communication. Clarity for the next right step.
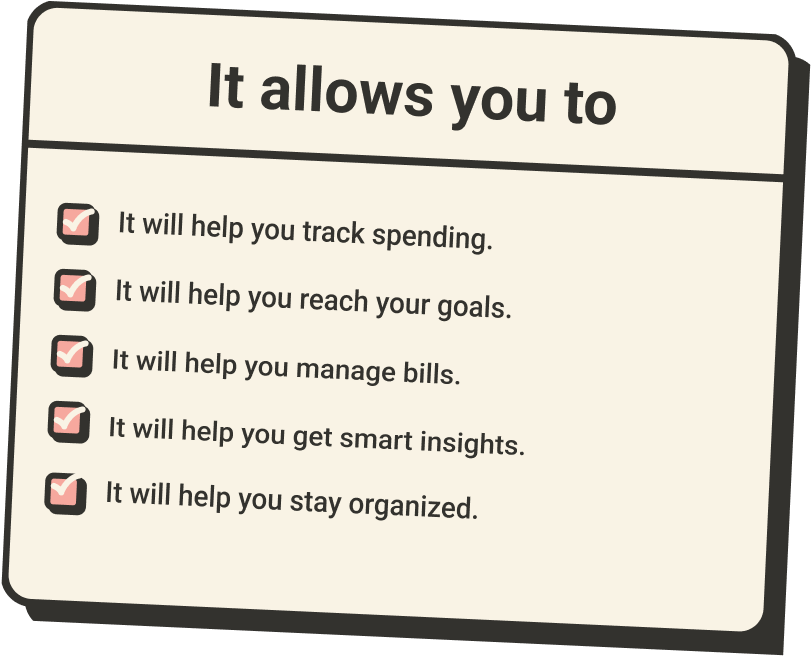
Check in at a glance. Balance handles the busywork so you can focus on what matters most. See where your money is, plan your next move, and reach your goals together.
What exactly is Balance?
A simple way to manage money together.
Understand your money, make decisions as a team, and build the future you want.

Built for Two
Budget together with ease. Both partners see the same information in real time, keeping you aligned on everyday spending.

Auto-Synced Accounts
Connect your accounts and see your money in one place. Transactions update automatically so you know where you stand without checking multiple apps.

Simple by Design
Begin with a clean, prebuilt budget and make it yours in seconds. Easy to start, effortless to adjust.
How does it really work?
From "Where is everything?" to "Oh, that's easy."
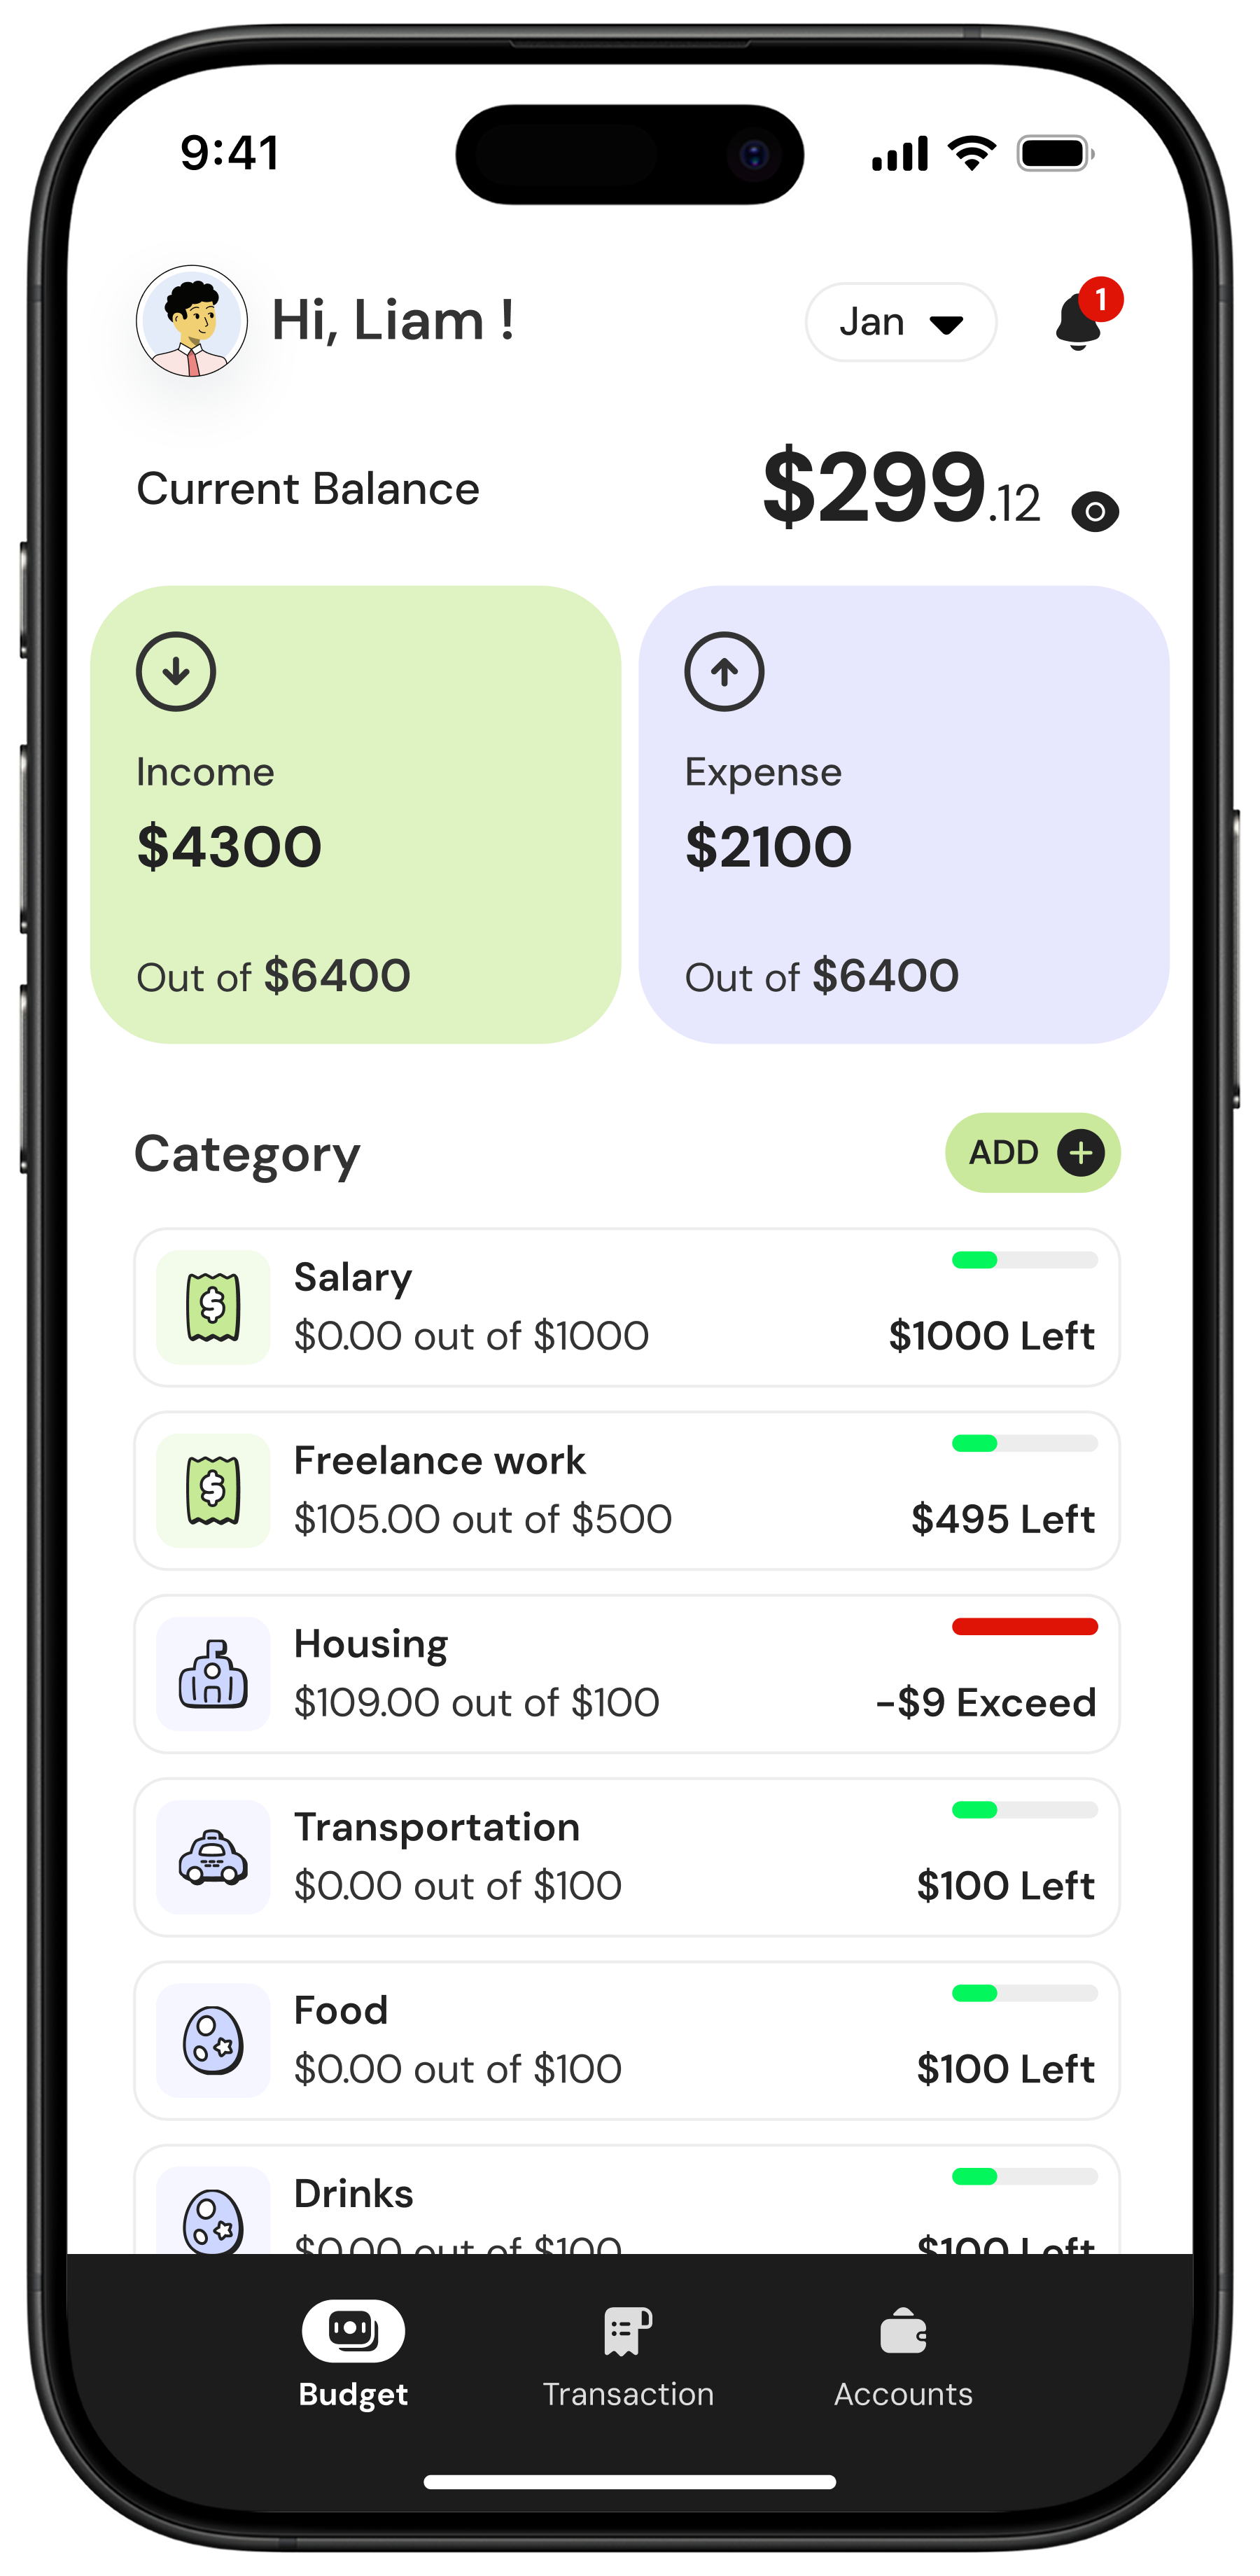
Balance pulls everything into a single view, helping you both see the full picture.

- Feeling stuck on your goals with no clear reason why
- Not sure where your money is going
- Feeling like you're the only one managing the budget
- Having to ask your partner before spending
- Being out of sync with each other

- You're in control of your money, not the other way around
- Clear progress toward your goals with no guesswork
- Sharing the load of keeping your budget up to date
- Balance becomes your shared source of truth for "can we buy this?"
- Your energy goes toward the big things you care about, not the busywork

Setup & Sync
Setup Once and Stay in Sync
Get connected and stay in control together. Whether you're brand new to budgeting or done with complicated systems, Balance helps you and your partner get aligned quickly. It's your easy button for shared money: simple setup, automatic updates, and always-on syncing.
Learn more about setupDaily Money Management
See Your Full Financial Picture
Real-time clarity for both of you. Balance gives you the tools to understand your spending, stay organized, and make confident decisions together without the overwhelm.
Learn more about daily management
Growth, Support & Trust
Grow Confidently, Together
Support when you need it and security you can trust. Balance gives you space to learn, improve, and stay motivated — all while knowing your information is safe and the app is growing with you.
Learn more about support
Built for Couples
Together, Your Money Makes More Sense
Designed for the way couples actually manage money. Balance turns financial stress into shared clarity and helps you work as a team, from small daily choices to big life plans.
Learn more about couples features
Affordable Pricing
Yes, it costs money. No, it's not a boring spreadsheet.
If we could offer it for free, we would. We care about your privacy, security, and making budgeting enjoyable. Balance was built from the ground up to be the most affordable live bank-connected budgeting app on the market. Paying for a tool to help you stay on track shouldn't feel like a burden. One price covers both partners, and our mission-driven pricing keeps it less than the cost of a cup of coffee a month.
Monthly
Perfect for trying Balance month-to-month.
$5.99/mo
 Shared Account for Two
-
Quick & Guided Onboarding
-
Secure Bank Connections
-
Track Every Dollar
-
Customizable to Your Life
-
Net Worth Overview
-
Real-Time Multi-Device Sync
-
Free 30-Day Trial
-
…and more

Yearly
Best value for long-term budgeting success.
$59.99/yr
-
Shared Account for Two
-
Quick & Guided Onboarding
-
Secure Bank Connections
-
Track Every Dollar
-
Customizable to Your Life
-
Net Worth Overview
-
Real-Time Multi-Device Sync
-
Free 30-Day Trial
-
…and more
Frequently Asked Questions
Questions You Pretend You Don't Have
We get it—money apps can feel overwhelming at first. Here are answers to the most common questions about Balance, how it works, and how it can make managing your finances simpler, smarter, and stress-free.
What makes Balance different from other budgeting apps?
Balance is built for couples from day one, not adapted later. You each get your own profile, shared visibility, and real-time updates so you always know where things stand. Instead of feeling like one person is "doing the budget," you work as a team with one clear, shared source of truth.
Do both partners get access for one price?
Yes. One subscription covers both of you. No extra charges, no add-ons, and no upselling just because you budget as a team.
How does Balance connect to our bank accounts?
Balance connects securely to over 12000 banks using Plaid, the same trusted service behind many leading financial apps. Your transactions sync automatically, and we never store your bank credentials.
You can learn more on our security page.
How does Balance help us track spending and stay on budget?
Balance automatically pulls in your transactions, sorts them into categories, and shows your spending in real time. You can split purchases, adjust categories, and review trends together. Instead of strict rules, we help you see what's happening so you can make confident choices moving forward.
What if my partner isn't that into budgeting?
That's exactly why Balance exists. We remove the steep learning curves and complicated systems so both partners can stay aligned effortlessly. Even if one person starts more involved, Balance keeps everything clear, simple, and shared so you naturally move toward budgeting as a team.
Can we use Balance on all our devices?
Yes. Balance works on iOS, Android, Mac, and the web, and everything stays in sync. No matter where you are, you both see the same information.
Is my financial data secure?
Yes. Balance uses industry-standard security, including 256-bit encryption, and all bank connections are handled through Plaid. We never store your login details, and Balance has read-only access only.
For the full details, see our security page.
Can I add cash spending or accounts that don't sync?
Absolutely. You can manually enter transactions or create accounts for things like cash envelopes, smaller banks that aren't yet supported, or personal sinking funds. Balance keeps everything in one place.
How does Balance help us plan for goals?
You can set savings goals, budget targets, or larger shared goals, and Balance tracks your progress automatically. Whether you're saving for a trip, paying down debt, or building an emergency fund, you'll see your progress grow together in real time.
Can I cancel anytime?
Yes. You can cancel whenever you want. Your subscription stays active until the end of the current billing period, and you won't be charged again.
Balance is your all-in-one money buddy that keeps your budget, goals, and spending on track—without the stress.